Program Overview
This intensive 3-day online program is designed to take participants from Tableau basics to advanced visualization techniques. Through hands-on exercises and real-world case studies, you'll learn to create impactful dashboards that drive data-driven decision making in your organization.
Why Attend?
- Master Tableau fundamentals and advanced features
- Learn to transform raw data into compelling visual stories
- Create interactive dashboards for business insights
- Develop best practices for effective data communication
Who Should Attend?
- Business Analysts
- Data Analysts
- Financial Analysts
- Marketing Professionals
- Managers & Executives
- Researchers
- IT Professionals
- Anyone working with data
Key Highlights
- Comprehensive Coverage - From basics to advanced visualizations
- Hands-on Exercises - Real datasets from various industries
- Dashboard Design - Principles of effective visual communication
- Data Blending - Combining multiple data sources
- Advanced Calculations - LOD expressions and table calculations
- Storytelling with Data - Creating narrative visualizations
- Certificate of Completion - Professional credential
- Lifetime Access - To course materials and updates
Program Schedule: Data Visualization using Tableau
5th January 2026 – 7th January 2026
Day 1: Monday, 5th January 2026 - Tableau Fundamentals
- 10:00 AM – 11:30 AM: Introduction to Tableau: Interface & Workspace Navigation
- 11:30 AM – 11:45 AM: Coffee Break
- 11:45 AM – 01:15 PM: Essential Visualizations: Bar, Line, Pie, and Scatter Plots
- 01:15 PM – 02:15 PM: Lunch Break
- 02:15 PM – 03:45 PM: Data Preparation: Connecting, Cleaning, and Shaping Data
- 03:45 PM – 04:00 PM: Short Break
- 04:00 PM – 05:30 PM: Hands-on Lab: Creating Your First Dashboard
Day 2: Tuesday, 6th January 2026 - Advanced Visualization Techniques
- 10:00 AM – 11:30 AM: Advanced Charts: Dual Axis, Combined, and Bullet Graphs
- 11:30 AM – 11:45 AM: Coffee Break
- 11:45 AM – 01:15 PM: Working with Parameters, Sets, and Groups
- 01:15 PM – 02:15 PM: Lunch Break
- 02:15 PM – 03:45 PM: Tableau Calculations: LOD Expressions and Table Calculations
- 03:45 PM – 04:00 PM: Short Break
- 04:00 PM – 05:30 PM: Hands-on Lab: Building Interactive Dashboards with Filters
Day 3: Wednesday, 7th January 2026 - Dashboard Design & Deployment
- 10:00 AM – 11:30 AM: Dashboard Design Principles and Visual Best Practices
- 11:30 AM – 11:45 AM: Coffee Break
- 11:45 AM – 01:15 PM: Storytelling with Data: Creating Narrative Visualizations
- 01:15 PM – 02:15 PM: Lunch Break
- 02:15 PM – 03:45 PM: Performance Optimization and Publishing to Tableau Server/Online
- 03:45 PM – 04:00 PM: Short Break
- 04:00 PM – 05:30 PM: Final Project: End-to-End Dashboard Solution Presentation
All sessions include hands-on exercises with real-world datasets. Participants should bring laptops with Tableau Desktop (Public or Pro version) pre-installed. Coffee breaks and lunch will be provided.
Meet Your Program Director

Prof. (Dr.) Brajesh Kumar
Professor of Economics | Data Scientist | GST Expert | Program Director, MBA (Financial Management) | Data Scientist | Machine Learning Architect | Computational Econometrician | Chief Editor, NIFM Journal of Public Financial ManagementProf. (Dr.) Brajesh Kumar, a distinguished academician with ~28 years of experience, serves as Professor of Economics and Program Director (MBA-FM) at AJNIFM. He holds advanced degrees in Economics, Business Analytics, and Computer Applications, and is a certified Lean Six Sigma Black Belt. His expertise spans GST, data science, machine learning, and computational econometrics.
A prolific trainer and consultant, Dr. Kumar has led 220+ MDPs, advised government bodies on taxation and finance, and contributed to national and international research projects. He has represented India at global academic forums and developed digital governance tools using PHP, MySQL, and AI-based analytics.
"This Tableau program exceeded my expectations. In just three days, I went from barely knowing the interface to creating professional dashboards that impressed my management team. The hands-on approach with real business datasets made all the difference."
Program Details
Dates: 5th January 2026 – 7th January 2026
Duration: 3 Days | 15 Hours of Intensive Training
Mode: Online (Live Interactive Sessions)
Platform: Zoom + Tableau Online (Links provided after registration)
Program Director: Prof. (Dr.) Brajesh Kumar
Fees: ₹15,000 per participant
Includes comprehensive course materials, datasets, and certificate
Group discounts available for 3+ participants
Status: Open for Registration
Technical Requirements:
- Tableau Desktop (Trial version acceptable)
- Stable internet connection
- Secondary monitor recommended for optimal learning experience
Register Now
Contact Information
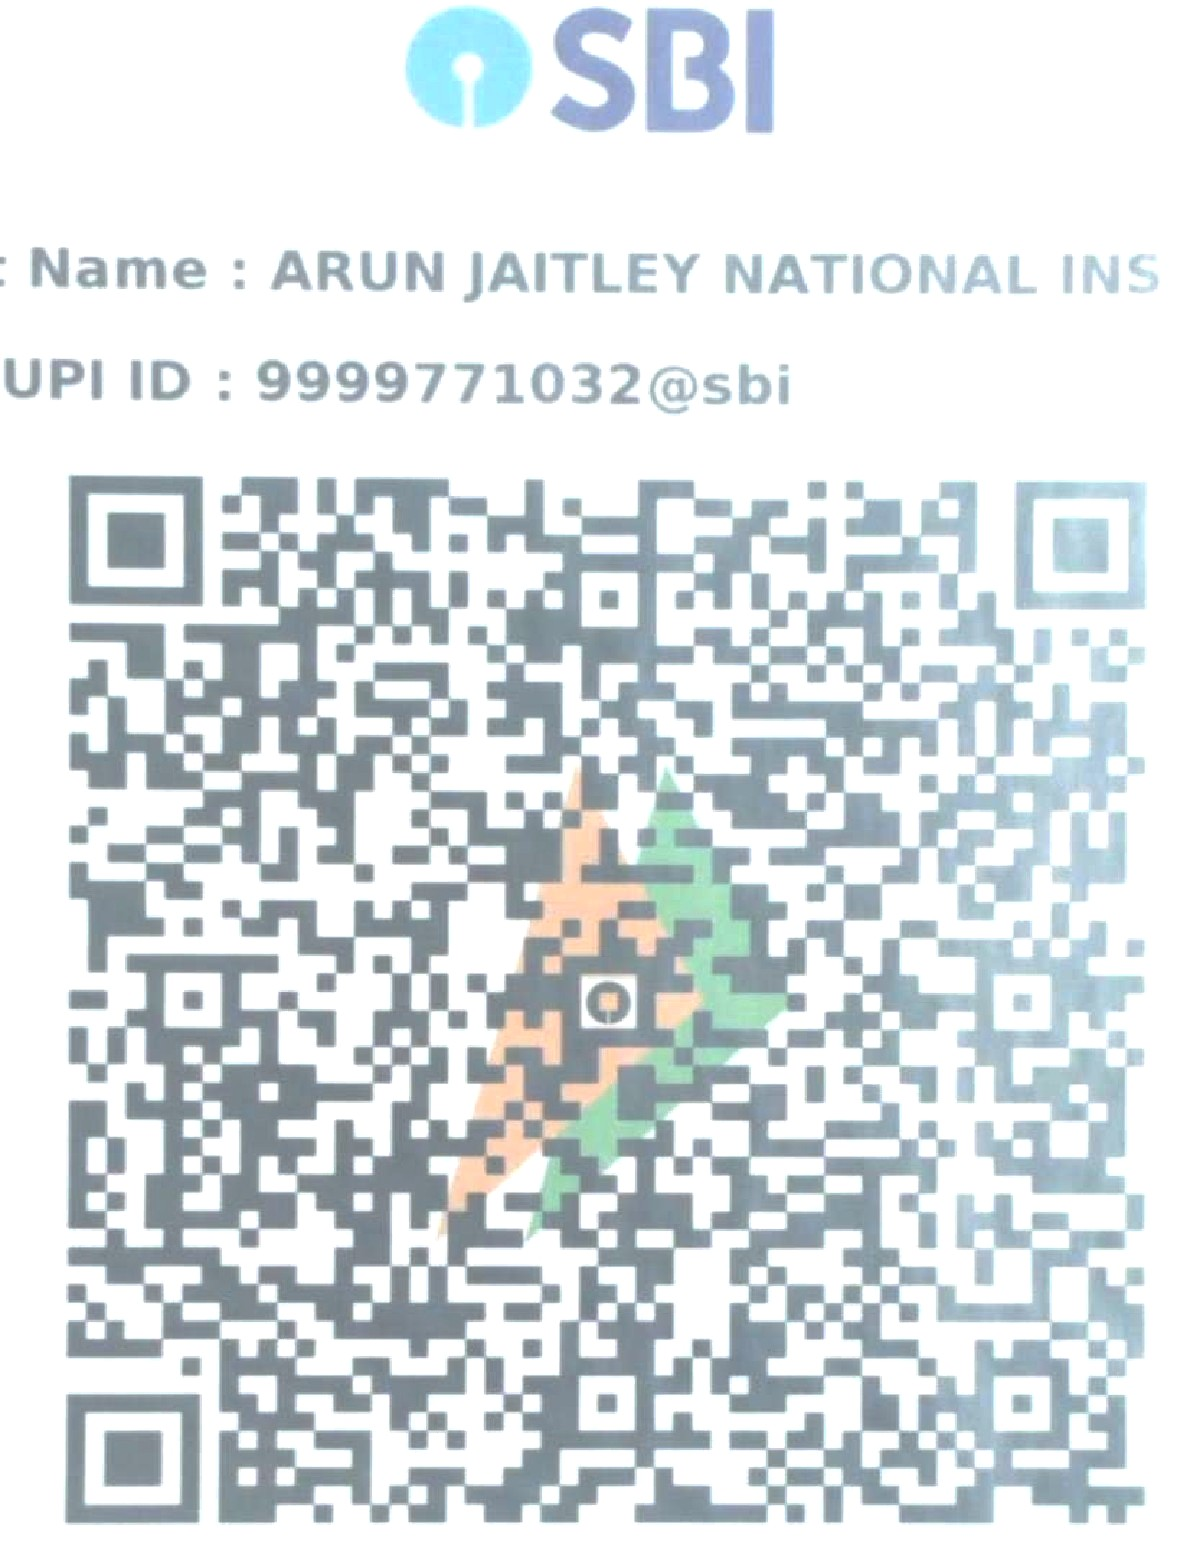
Scan to Pay Fees

Fee: ₹15,000
Registration Form
Complete the form below to register for the program
